Weather & Observing Conditions
Access detailed hourly forecasts for any selected location with special emphasis on seeing conditions & sky quality index.
Quickly Determine Quality Observing Windows
Scroll through automatically generated daily reports that rate your chance for observing success.
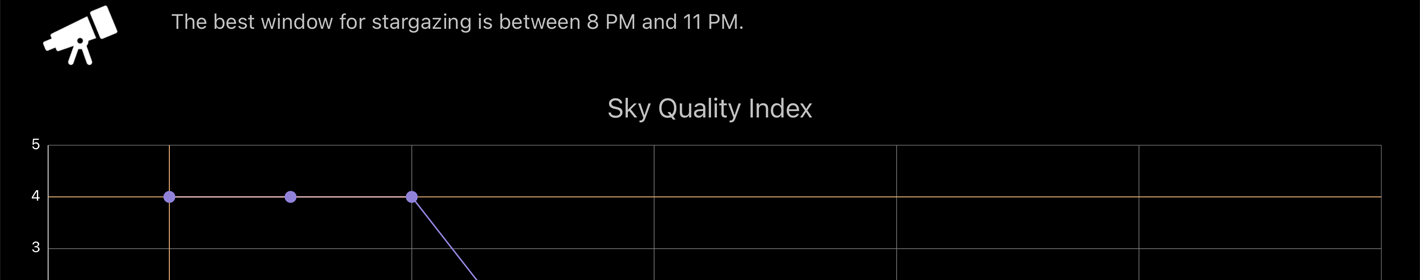
Sky Quality Index Graph
Weather data for your location is presented with the hourly Sky Quality Index graph.
Key Data Points at a Glance
From Astronomical Seeing Index to precipitation chances, wind speed, humidity, dew point etc.
Much More Planned!
Custom alerts, event finder integration, details on conditions for each observing site, calculated distances/directions to travel to reach desired observing conditions, integration with light pollution maps, etc.